Genetic structure in present-day populations is driven by both demographic events (e.g. migrations, bottlenecks, admixtures), and by ongoing population-structural dynamics (spatial structure, mating systems, age structure). One of the longest-running debates in population genetics has been about the relative importance of these events in forming the genetic diversity of present-day Europe. In particular, the relative importance of migration/admixture and ongoing spatial structure, and the extent to which observed genetic structure, in particular thorough PCA, is informative about these processes.
Briefly, genetic structure was first interpreted almost entirely as the echo of ancient migrations. Later technical work showed that the observed genetic patterns could also be the result of non-migratory processes and that, empirically, new and larger datasets seemed consistent with the view that isochronic spatial structure drove most of the genetic patterns. In the last few years, ancient DNA has swung the pendulum back to the first view-seemingly proving that the majority of genetic structure is driven by a relatively small number of large historical migrations. However, sampling of ancient populations is still limited, and geographically constrained, so it remains difficult to quantify the contribution of spatial structure.
The old school
Cavalli-Sforza and colleagues were the first people to really push the idea that present-day genetic data contained fine-scale information about historical processes For example the two plots below from Menozzi et al (1978) show the first principal components of gene frequency (left), and compare with the archaeological dates of the first evidence of farming across Europe (right). They interpreted the similarity of these plots as evidence that 1) The introduction of farming to Europe was driven by migration rather than cultural transmission and 2) The genetic structure of present-day Europe was largely created by this migration.
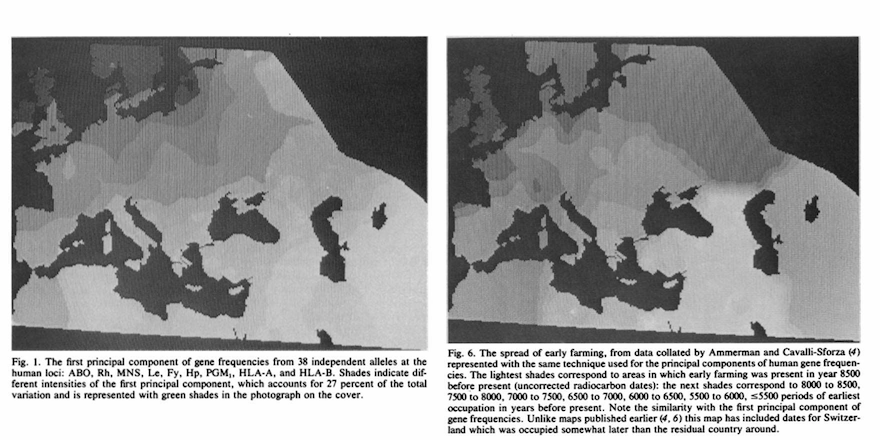
This then, is the “migratory” interpretation of genetic structure - which basically argues that any structure in genetic data that has a spatial component must be due to historial migrations in that space. This seems intuitive: it must be the case that migrations would lead to a spatial component in genetic data and, conversely, if there were no migration, and everything were isotropic, it seems plausible that there would be no visible structure in the genetic data. However, while plausible, this turns out not to be correct.
Caution
The major problem with the migratory interpretation is that the sort of directional patterns in genetic data that Cavalli-Sforza had associated with migrations could also be generated under a model without directional migration and, it turns out, arise naturally in simple, isotropic, models - particularly those with bounded edges (Sokal et al. 1999, Novembre and Stephens 2008, below left).
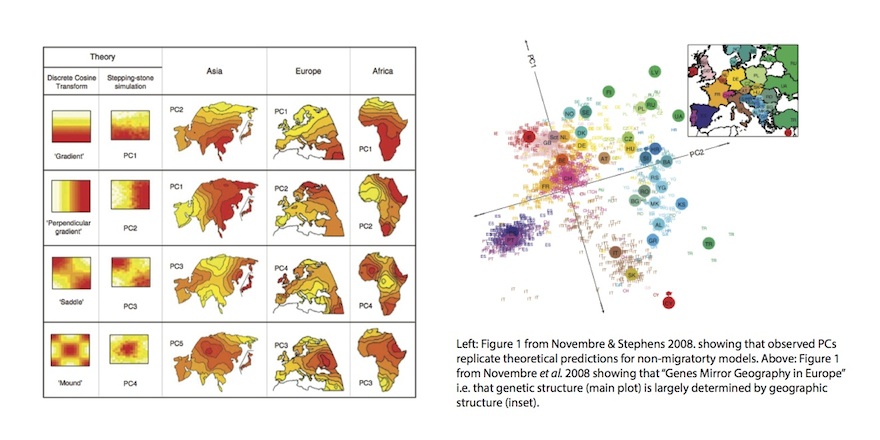
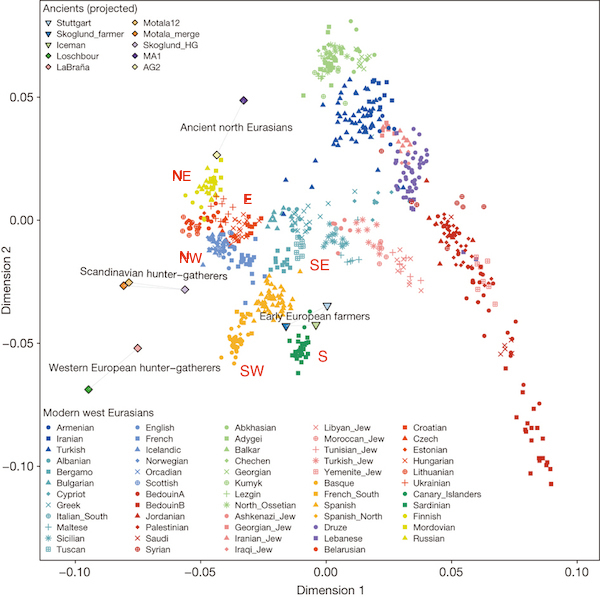
Further, Novembre et al. (2008) looked at genetic structure in Europe and produced the absolute classic figure above right, showing that if you plot the first two principal components of genetic data in a large European sample, it looks remarkably like a map of the geographic origins of the individuals. Now it could be the case that this was actually driven by migration, but the remarkable quantitative similarity of the two figures seems to suggest more of an ongoing but spatially homogenous process like isolation by distance (i.e. people just move about small but random distances from generation to generation). On the other hand, Lazaridis et al. (2014) make a PCA plot of a different set of Europeans (below), which doesn’t look so obviously like a map of Europe. In fact, they devote several pages in the supplement to explaining why it is different from Novembre et al. (because PCA depends on the sampling scheme). But to me, that’s not really the point because it really does still look like a map of Europe. It’s a bit distorted, but qualitatively everything’s in the same relative configuration (I annotated with compass points in red). So at this point it looks like present-day data can’t really distinguish between continuous spatial structure, and migrations that are correlated with geography (as they almost always are). How can we get around this problem? The ancient samples on the Lazaridis et al. plot provide a clue.
Insight from ancient DNA
In principle, ancient DNA can resolve this ambiguity. If all the structure comes from historical migrations, then 1) people from before the migration will look [genetically] different from people afterwards and 2) the genetic structure of present-day people will correspond to differences in the ancestry that they have from the ancient populations. On the other hand, if all the structure comes from isolation by distance, then ancient people will look more or less like present-day people and the stucture of the ancient populations will look like that of the present.
So, what does the ancient DNA show? In some sense, it vindicates the migrationist view. None of the ancient populations of Europe look genetically anything like modern populations until around ~2500 BCE. In particular, there are two major migrations into Europe that replace large proportions of the ancestry that was previously present (e.g. Haak et al. 2015, Allentoft et al. 2015). One, starting around 6400 BCE is associated with the migration of Early Farmers from Anatolia into Europe, starting in the southeast and moving north and west. The second, starting around ~2500 BCE is associated with migrations from the Steppe, perhaps associated with the introduction of Indo-European languages.
Though neither of these migrations led to total population replacement - in both cases the migrants mixed with the populations that were already there - they both had an extremely dramatic effect, particularly the migration of farmers. For example (Cassidy et al. 2016), even at the extreme end of Europe, the people who lived in Ireland before ~5,500 years are almost entirely unrelated to the farmers who largely replaced them at that time. But even those farmers are not very closely related to present-day Irish people. In fact, Irish people of 5000 years ago are genetically closer to present-day Sardinians (who are a lot like the Early Farmers) than they are to present-day Irish.
So it seems like ancient DNA has totally proved the migrationist interpretation, at least in Europe? However…
Spatial structure in ancient DNA
One problem is that sampling of ancient DNA remains geographically limited. Many of the samples we analyse are geographically and temporally clustered, and many are from the same cemeteries, so it’s hard to know whether that clustering of samples is driving some of the results we see. Perhaps the fact that we’re sampling populations that are relatively more closely related than present-day samples tend to be, means that we overestimate the extent of population discontinuity over both space and time, or perhaps because of our limited sampling we’re missing out on spatial structure in the ancient populations.
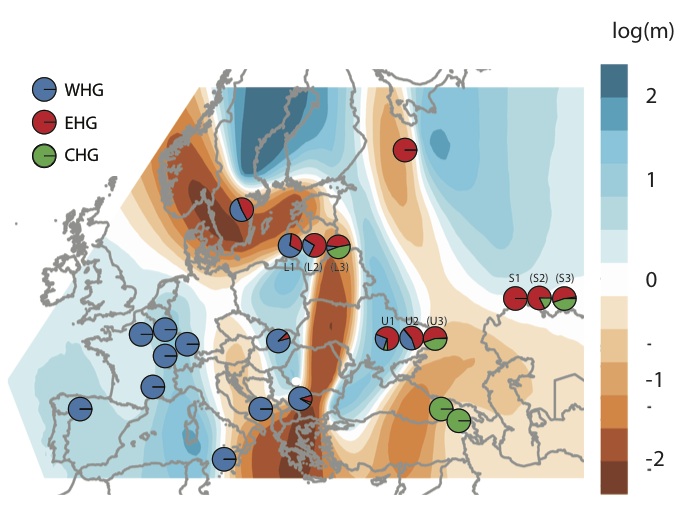
We tried to get at this question a bit in a recent preprint (Mathieson et al. 2017). We now have data from quite a lot of Mesolithic hunter-gatherers, and we fitted a spatial migration model to data from these individuals (below, using the EEMS package by Petkova et al.). This seems to suggest that the spatial structure in Europe is defined by two major clusters (Western and Eastern hunter-gatherers; WHG/EHG) separated by a barrier (red; low migration rates), but with fairly open migration apart from that (blue; high migration rates). In places where we have time series, the series of pies show temporal changes, mainly showing the appearance of Caucasus hunter-gatherer ancestry (green) in Eastern Europe. The way that I’m thinking of this is that there is always ongoing isolation by distance, though not always isotropic, that is occasionally disrupted by dramatic migrations which are then homogenised over time. Then, it becomes a quantitative question of how much of present-day variation is explained by each of these processes - a question that I don’t think we really have a good handle on at this point.
Of course, this is not a very quantitative analysis and the right thing to do is to integrate the temporal information into something like EEMS or SpaceMix. I’m sure people are working on this already!