Neanderthal ancestry in 23andMe reports
Many people have told me that they have more/less Neanderthal ancestry than their spouse/friend/parents etc. However, 23andMe don’t actually report Neanderthal ancestry proportions - rather, they report the number of Neanderthal-derived variants you carry out of a set of around 1400 ascertained in Sankararam et al 2017. The procedure is described here. They also report which quantile you are in, in terms of these variants, and how you rank relative to people you know. Unfortunately these estimates don’t correspond very well to Neanderthal ancestry proportions.
Neanderthal ancestry worldwide
But, suppose you wanted to know what proportion of Neanderthal ancestry you actually carried. One approach is to calculate it with an \(f_4\) ratio statistic. Using this, and data from the Simons Genome Diversity Project (SGDP), Pruefer et al 2017 estimate that Neanderthal ancestry in Eurasians varies from about 2.4% in Europeans to 2.6% in East Asians. A back of the envelope calculation1 suggests that if the average Neanderthal ancestry fraction is 2.5%, then the standard deviation among individuals would be on the order of 0.1%. Intuitively, this is small, because the Neanderthal introgression was so long ago that almost all the variation among individuals has been removed. This variation is similar to the statistical uncertainty in the ancestry proportion in a single individual using \(f_4\) ratio statistics, which suggests that using \(f_4\) ratios would be a very noisy way to estimate your own Neanderthal ancestry.
An indirect estimate of Neanderthal ancestry
Among people with the same genome-wide ancestry, there is likely very little variation in Neanderthal ancestry. So an indirect way of estimating Neanderthal ancestry would be to just assume that Neanderthal ancestry proportion is just a function of genome-wide ancestry, and estimate that function. To do this, we first estimate Neanderthal ancestry in the SGDP, as in Pruefer et al. Then, we restrict the SGDP data to SNPs that are found on the 23andMe genotyping array and compute its principal components. Next, we can project our 23andMe results onto the PCs defined by the SGDP. Finally, we fit a model to the SGDP data that expresses Neanderthal ancestry as a function of the first few PCs. So when we project our 23andMe data onto the SGDP PCs, this model gives us an estimate Neanderthal ancestry. The kind of model we need to fit is called a generalised additive model and can be fit using the R package mgcv.
Indirect, but not that intersting.
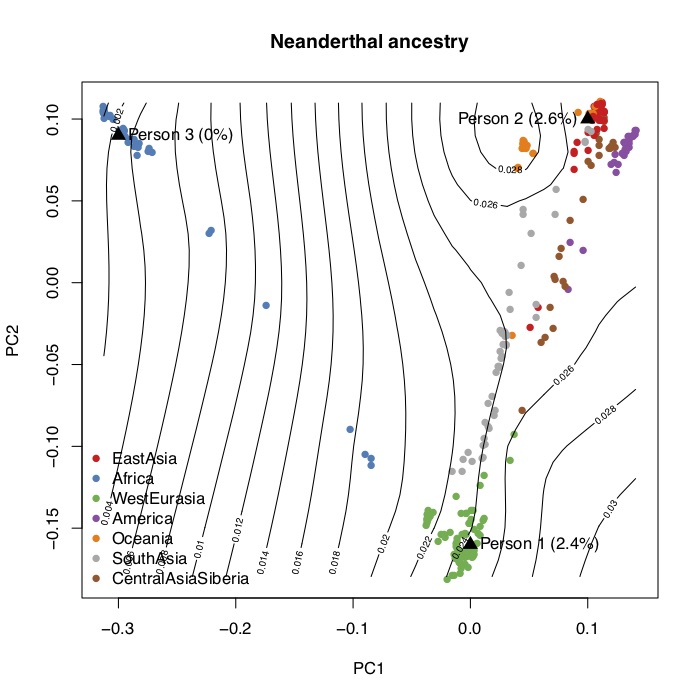
I computed the statistics described above and wrote an R script to project 23andMe genotype data. The figure below shows the first two principal components of the SGDP, and the contour lines show the corresponding proportions of Neanderthal ancestry. You can generate this figure and project your own 23andMe data onto the PCs using the scripts here. It’s not that interesting though, because Neanderthal ancestry is just a function of genome-wide ancestry so two people with similar ancestry will always have the same genome-wide ancestry.
Other approaches.
If you wanted to get a fully personalized estimate, you could combine this with an \(f_4\) ratio on the data itself - e.g. you could use this estimate as a prior, and use the \(f_4\) ratio and error to compute a posterior. I’m not sure that this would actually help very much, since the uncertainties are so high. But you might be able to identify people (if there are any) who have particularly extreme Neanderthal ancestry proportions. With large datasets you could recompute \(f_4\) ratio proportions and principal components on that dataset itself and get more accurate estimates, as well as individual level estimates.
-
Assuming that the Neanderthal ancestry was all introduced~2000 generations ago and is broken up into ~1000 chunks per chromsome, then if the average Neanderthal ancestry fraction is 2.5%, the standard deviation would be around 0.1% (i.e. sqrt(0.025*(1-0.025)/22000)). ↩